Data Analytics
A/B Testing, Causal Inference Tableau, Power BI, Google Analytics Microsoft Excel
May 10, 2025
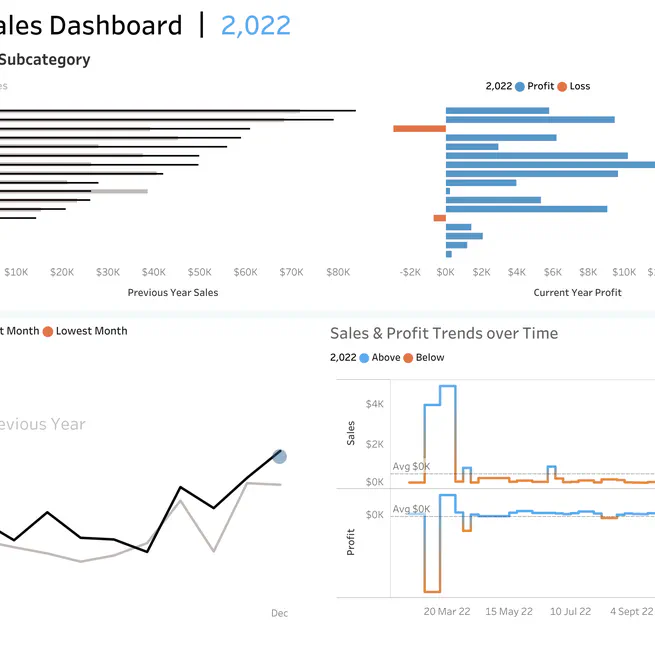
Sales & Profit Performance Dashboard
This Tableau dashboard visualizes sales and profit trends across product categories, regions, and time. It helps uncover underperforming segments, guides strategic pricing and discounting decisions, and supports executives in driving revenue growth.
May 2, 2025
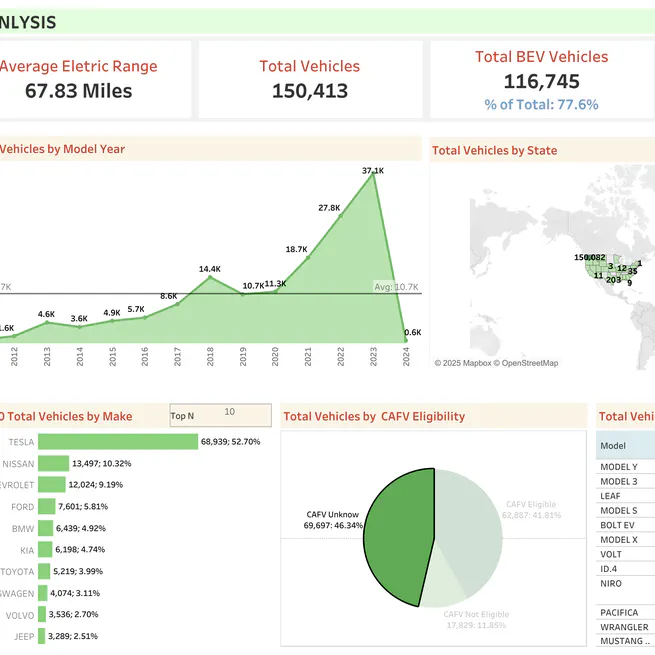
Electric Vehicles Analysis
This interactive dashboard analyzes electric vehicle sales and trends across manufacturers and countries. Built in Tableau, it uncovers regional market performance, highlights top-selling models, and helps interpret the dynamics driving global EV adoption.
May 2, 2025